We're gearing up to present TWO investment opportunities in the Kansas City metro area. Both options are promising, each with its unique features that cater to different preferences in your buying strategy.
This week is particularly advantageous for buyers in Kansas City for a couple of reasons: A. The weather is very cold, encouraging potential buyers to stay indoors in the warmth. B. The local NFL team, the Chiefs, has a significant game this weekend, and they are a big deal for the locals.
In essence, it's a great time for you to capitalize on these factors to your advantage.
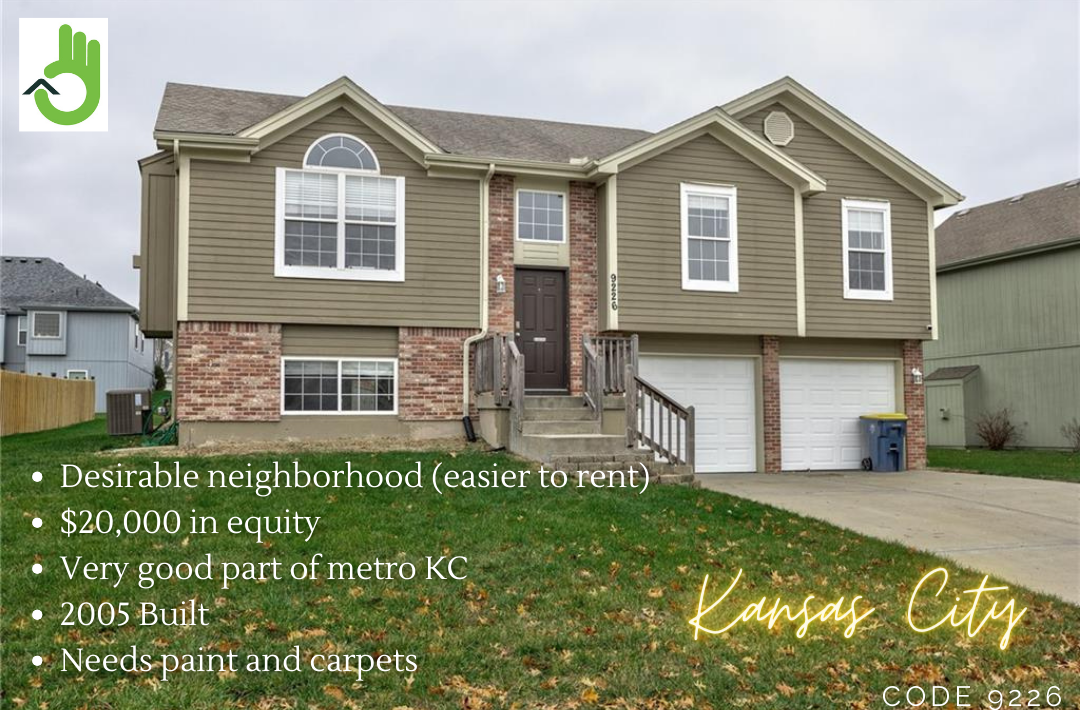
House #1 – code 9226
Bedrooms
4
Bathrooms
2.5
Square Feet
1895
Year Built
2005
Garage Size
2
Schools Rating(scale 3-30, 30 is best)
18
Lot size (sq ft)
10,659
Type
Single Family
Offer used for analysis
$320,000
Suggested offer (low)
$315,000
Suggested offer (high)
$320,000
Asking
$320,000
Market Value (after improvements)
$350,000
Estimated Improvements (lower)
$8,000
Estimated Improvements (upper)
$12,000
Financing Assumptions
Down Payment (%)
30%
Down Payment Amount
$96,000
Financed Amount
$224,000
Interest Rate
6.875%
Mortgage Term (Years)
30
Monthly Mortgage Payment
$1,472
Cash Outlay (Total Out of Pocket)
$114,016
Estimated Financial Assumptions
Monthly
Yearly
Rent (upper)*
$2,100
$2,200
$26,400
Rent (lower)*
$2,000
$24,000
Property Taxes
$195
$2,340
Insurance
$120
$1,440
Repairs
75
$70
$840
Property Management Monthly (%)
7.2%
Property Management Monthly ($)
$150
$1,802
Leasing Fee
68%
$59.1
$709
HOA or Fixed Costs
$38
$456
Vacancy Rate
4.0%
Total Fixed Expenses
34%
$710
$8,522
Total Expenses (Fixed + Mortgage)
$2,182
$26,181
Financial Analysis / Deal Attractiveness
Years:
5
10
Cap Rate
0.2%
1.5%
Net Cash Flow
$860
$17,581
Equity Increase
$89,258
$200,435
Total Gain
$90,118
$218,016
Average Cash Flow/Year
$172
$1,758
Average Cash Flow/Month
$14
$147
Average Gain/Year
$18,024
$21,802
Average ROI
79.0%
191.2%
Annual ROI
15.8%
19.1%
Projected Property Value
$425,829
$518,085
If you make an extra payment every year of $172 you will payoff your mortgage in 29 years, and save $17254 on interest.
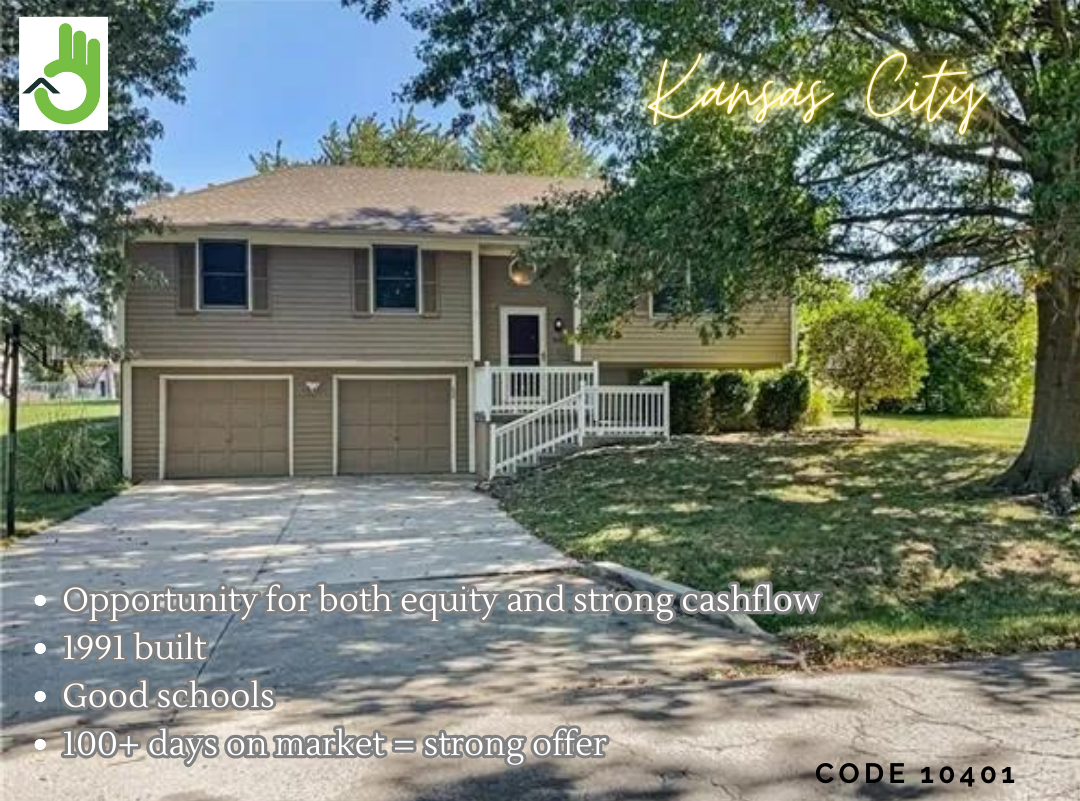
House #2 – code 10401
Note: this houses comes with solar panels that are paid off!
Bedrooms
3
Bathrooms
2
Square Feet
1826
Year Built
1991
Garage Size
2
Schools Rating(scale 3-30, 30 is best)
20
Purchase Assumptions
My Offer
Offer used for analysis
$265,000
Suggested offer (low)
$265,000
Suggested offer (high)
$270,000
Asking
$281,000
Market Value (after improvements)
$320,000
Estimated Improvements (lower)
$7,500
Estimated Improvements (upper)
$9,500
Financing Assumptions
Down Payment (%)
30%
Down Payment Amount
$79,500
Financed Amount
$185,500
Interest Rate
6.875%
Mortgage Term (Years)
30
Monthly Mortgage Payment
$1,219
Cash Outlay (Total Out of Pocket)
$94,638
Estimated Financial Assumptions
Monthly
Yearly
Rent (upper)*
$2,075
$2,150
$25,800
Rent (lower)*
$2,000
$24,000
Property Taxes
$240
$2,880
Insurance
$125
$1,500
Repairs
75
$85
$1,020
Property Management Monthly (%)
7.2%
Property Management Monthly ($)
$148
$1,780
Leasing Fee
68%
$58.4
$700
HOA or Fixed Costs
$0
$0
Vacancy Rate
4.0%
Total Fixed Expenses
35%
$734
$8,805
Total Expenses (Fixed + Mortgage)
$1,952
$23,429
Financial Analysis / Deal Attractiveness
Years:
5
10
Cap Rate
2.7%
4.4%
Net Cash Flow
$12,973
$41,410
Equity Increase
$80,450
$180,467
Total Gain
$93,423
$221,877
Average Cash Flow/Year
$2,595
$4,141
Average Cash Flow/Month
$216
$345
Average Gain/Year
$18,685
$22,188
Average ROI
98.7%
234.4%
Annual ROI
19.7%
23.4%
Projected Property Value
$389,329
$473,678
If you make an extra payment every year of $2595 you will payoff your mortgage in 20 years, and save $100833 on interest.
Disclaimer
Information contained herein was obtained from sources deemed reliable, however, Simply Do It and/or the owner(s) of the property make no guarantees, warranties or representation as to the completeness or accuracy thereof. The presentation of the property is offered subject to errors, omissions, changes in price and/or terms, prior sale or lease or removal from the market for any reason without notice.
The analysis is provided “As Is”. All the information is believed to be accurate (except for the small effects of some simplifying assumptions), but is not guaranteed, and depends on the values entered for the property. This analysis is intended for the purpose of illustrative projections. The information provided is not intended to replace or substitute for any legal, accounting, investment, real estate, tax, or other professional advice, consultation, or service. Simply Do It and/or the owner(s) are not responsible nor liable for any damages arising from the use of the analysis info.