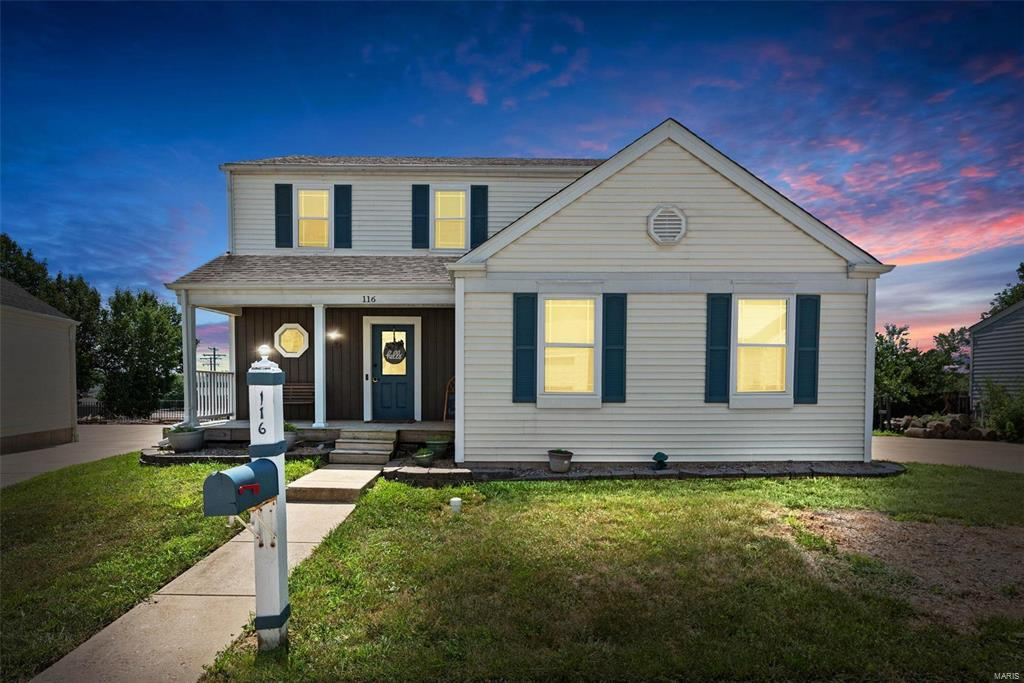
Turn Key Rental in St. Louis with $400/mo cashflow using 7% int rate (Code 116)
✅ small subdivision with a community pool
| A | Property Specifications | 1 |
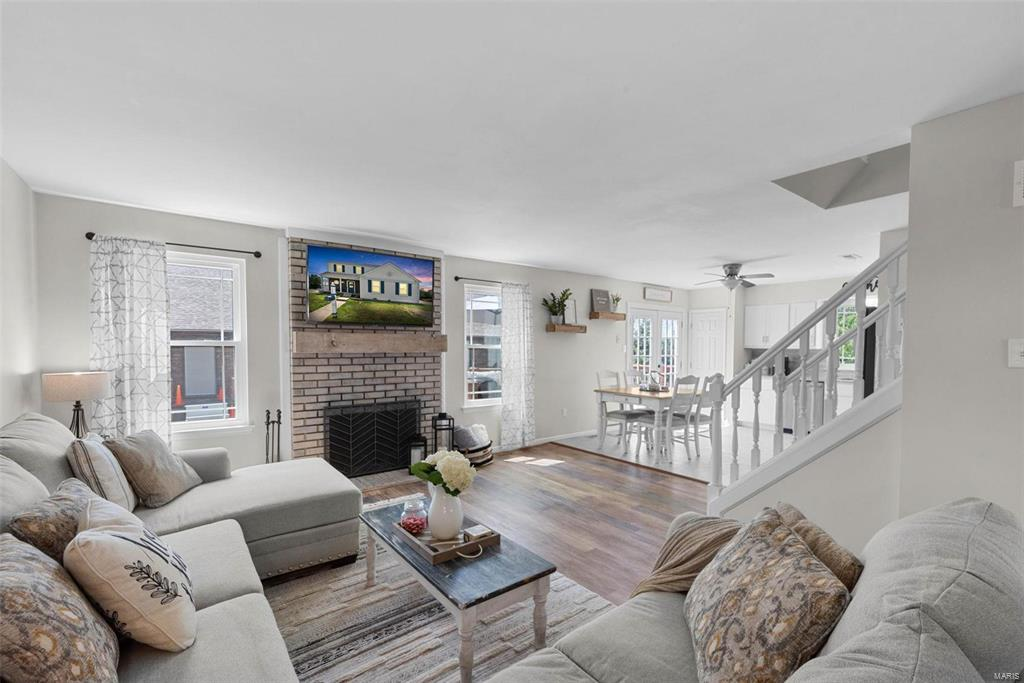
| Bedrooms | 3 | |
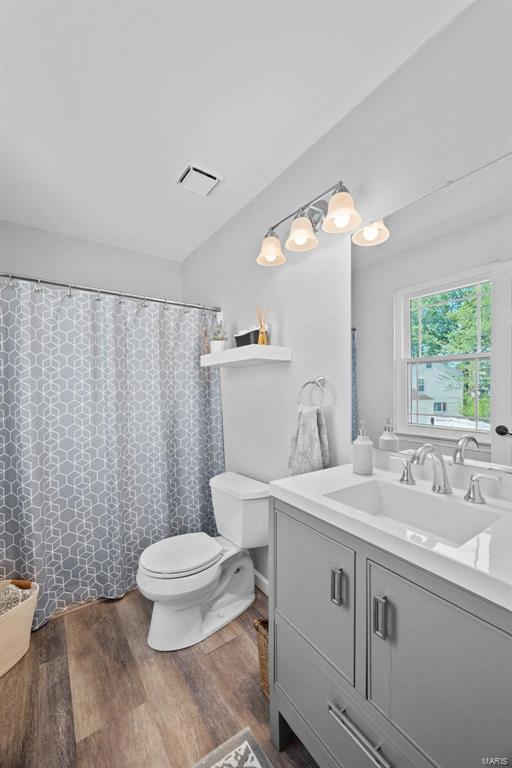
| Bathrooms | 2 | |
| Square Feet | 1300 | |
| Year Built | 1985 | |
| Garage Size | 2 | |
| Schools Rating (on scale of A-C) | A- |
| B | Purchase Assumptions | My Offer |
| Offer used for analysis | $275,000 | |
| Suggested offer (low) | $275,000 | |
| Suggested offer (high) | $280,000 | |
| Asking | $290,000 | |
| Market Value (after improvements) | $300,000 | |
| Improvements (lower) | $5,000 | |
| Improvements (upper) | $8,000 | |
| Closing Costs | $2,750 | |
| Mortgage Costs | $2,750 | |
| Other Fees At Closing (pts, . . . ) | $3,300 | |
| Total Cost | $290,300 | |
| Original listing date | 7/31/23 | |
| DOM (days on market – TODAY) | 32 |
| D | Financial Assumptions | Monthly | Yearly | |
| Rent (upper) | $2,175 | $2,250 | $27,000 | |
| Rent (lower) | $2,100 | $25,200 | ||
| Property Tax Rate (Approx.) | ||||
| Property Taxes | $20 | $240 | ||
| Insurance | $115 | $1,380 | ||
| Repairs | $100 | $1,200 | ||
| Property Management Monthly (%) | 7.0% | |||
| Property Management Monthly ($) | $152 | $1,827 | ||
| Leasing Fee | 75% | $68.0 | $816 | |
| HOA or Fixed Costs | $33 | $396 | ||
| Vacancy Rate | 4.0% | |||
| Total Fixed Expenses | 26% | $569 | $6,830 | |
| Total Expenses (Fixed + Mortgage) | $1,850 | $22,198 | ||
| 1 | Financial Analysis / Deal Attractiveness | ||
| Years: | 5 | 10 | |
| Cap Rate | 5.3% | 7.1% | |
| Net Cash Flow | $25,891 | $69,302 | |
| Equity Increase | $76,293 | $171,385 | |
| Total Gain | $102,183 | $240,687 | |
| Average Cash Flow/Year | $5,178 | $6,930 | |
| Average Cash Flow/Month | $432 | $578 | |
| Average Gain/Year | $20,437 | $24,069 | |
| Average ROI | 104.5% | 246.1% | |
| Annual ROI | 20.9% | 24.6% | |
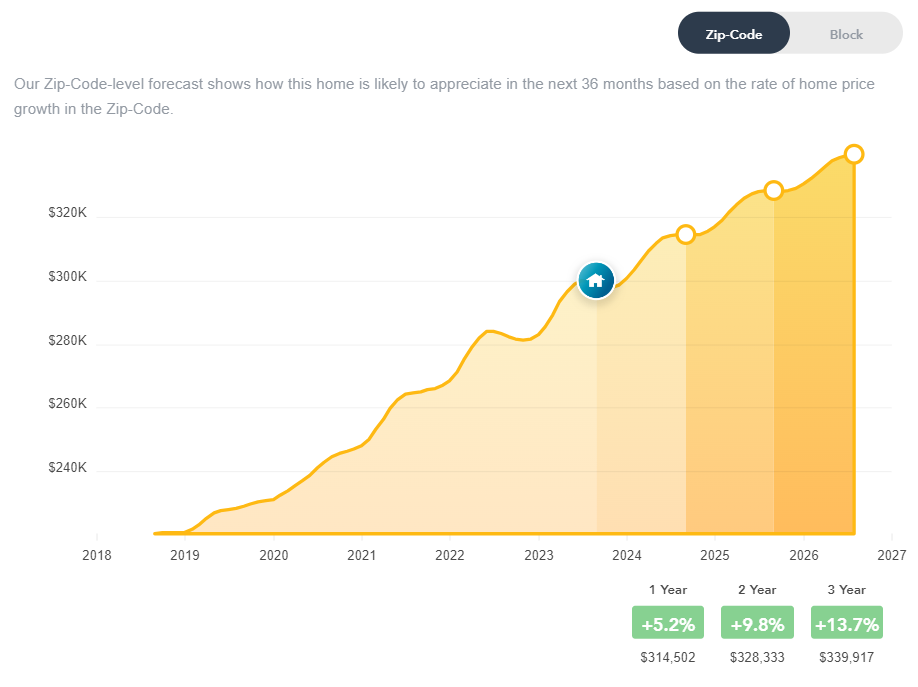
| Projected Property Value | $364,996 | $444,073 | |
| 3 | Property Ratings Suggestions | |||||
| Item | Suggested Criteria (Min.) | This Property | FAVORABLE / INSUFFICIENT | |||
| Schools | B | A- | FAVORABLE | |||
| Square Feet | 1,000 | 1,300 | FAVORABLE | |||
| Bedrooms | 3 | 3 | FAVORABLE | |||
| Bathrooms | 2 | 2 | FAVORABLE | |||
| Year Built | 1970 | 1985 | FAVORABLE | |||
| Rent/Price (%) | 0.75% | 0.73% | INSUFFICIENT | |||
| Average Cash Flow (at year 5) | $125 | $161 | FAVORABLE | |||
| Average ROI (at year 5) | 15% | 16.8% | FAVORABLE | |||
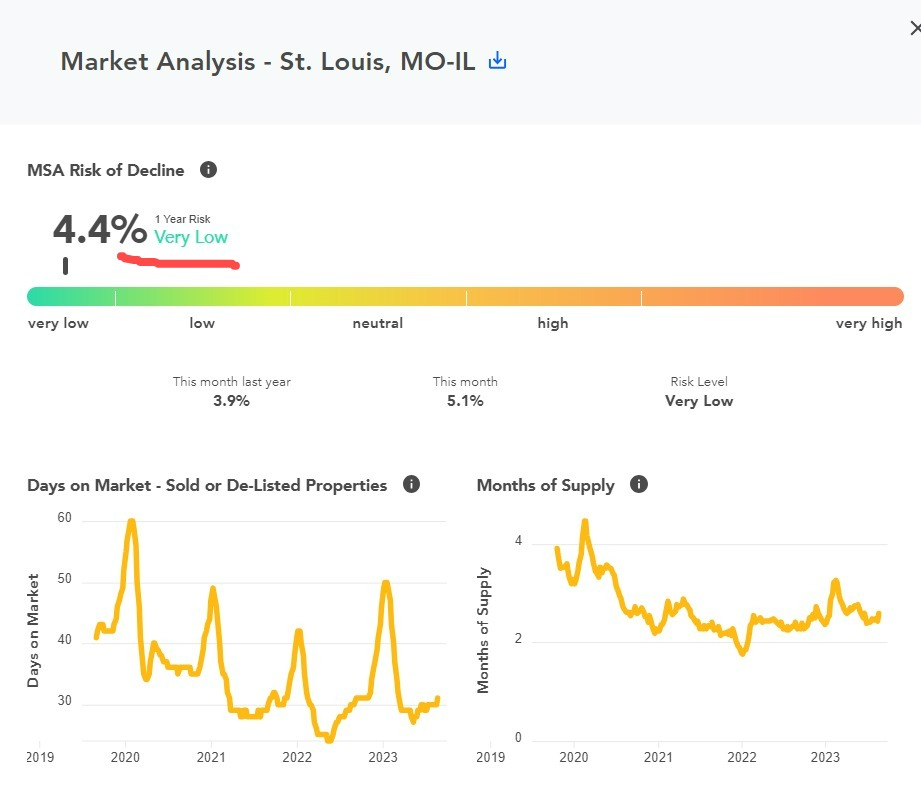
- 3.6% Median home price increased from June 2022
- 1.5 month supply of inventory (has not changed much since 2020)
- 23 Days on market average (Same as 2022 average)
- 14% decrease in new listings from last year
The one year risk of decline is a proprietary metric that measures the probability that this market's median home prices will be lower 12 months from now than the current market median price. This one-year chance of loss is derived through multivariate time series models using a combination of fundamental and technical indicators.
Disclaimer
Information contained herein was obtained from sources deemed reliable, however, Simply Do It and/or the owner(s) of the property make no guarantees, warranties or representation as to the completeness or accuracy thereof. The presentation of the property is offered subject to errors, omissions, changes in price and/or terms, prior sale or lease or removal from the market for any reason without notice.
The analysis is provided “As Is”. All the information is believed to be accurate (except for the small effects of some simplifying assumptions), but is not guaranteed, and depends on the values entered for the property. This analysis is intended for the purpose of illustrative projections. The information provided is not intended to replace or substitute for any legal, accounting, investment, real estate, tax, or other professional advice, consultation, or service. Simply Do It and/or the owner(s) are not responsible nor liable for any damages arising from the use of the analysis info.