Metros Comparison – I LOVE Austin but not for investing
Which metros do I like to invest in?
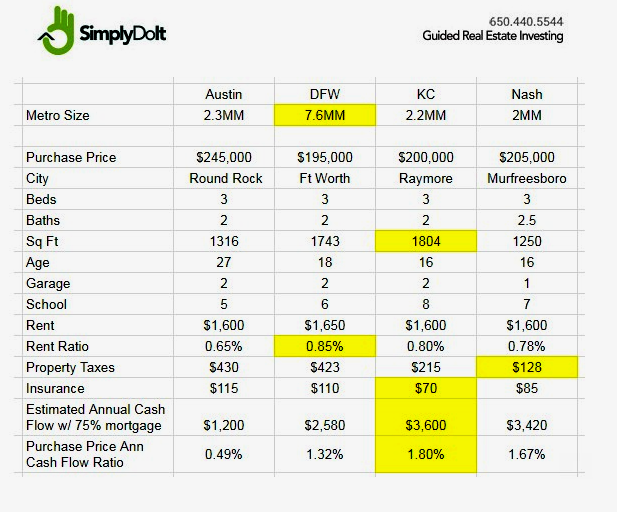
Let me share a metro comparison with you today.*Please note that these are estimates of rents, taxes, insurance, and cash flow – these figures are subject to change.
Worthy notes
We tried to compare apples-to-apples as much as possible.
Mainly, we wanted to show how certain US metros generate a much higher rent relative to the purchase price.
Also, we wanted to highlight the effect of property taxes and insurance rate on the cash flow – something investors tend to miss when doing an incomplete analysis.
Property taxes by themselves can be challenging but not a deal-breaker. Property taxes along with a lower rent could very much be a deal-breaker.
Bottom line
From this table, Kansas City gets many positive attributes such as high rent, high rent/sq. ft., and high cash flow-price ratio. Dallas Ft. Worth and Nashville come close to Kansas City. On the other hand, Austin comes last w/ the worst rent-price (or cash flow-price) ratio.
It is important to remember that there are other primary and secondary parameters when making an investment decision that may affect your ultimate investing area.
A few other parameters
As always, we prefer metro size to be above a certain threshold for a more stable investing area – size does matter and it projects on the strength of the local economy.
Typically, we prefer 3 beds and 2 baths, minimal. But, we don’t want houses that are too big either.
Age is the years age of the house. We prefer houses with less than 40 age. But, this isn’t necessarily a deal-breaker.
School ratings of a B or better, which translate roughly into a score of 5-7. 5 being a B-. 6 being a B. 7 being a B+.
Rent is used for calculating Rent Ratio. 1% is ideal, 0.8% is acceptable, but can adjust to suit the market as is the case shown on the chart above.
We make our calculations based on factors such as Property Taxes and Insurance to estimate annual cash flow and purchase price annual cash flow ratio.
—-
We hope this in-depth look at metro comparison is helpful for you.
Let us know if you have any questions!
Simply Do It wishes a happy holiday to you and everyone in your life!